Light at the End of the Tunnel – But it’s Not a Short Tunnel; Billabong’s Annual Report
What we have here is progress, but still a long way to go. That’s how Billabong’s management characterizes their results, and I agree. I’ll take a look at the financials as reported and with the impact of divestures and certain “significant items” removed. Regular readers know I’m not quite comfortable with some of the stuff that Billabong management characterizes as “significant” and removes from their operating results. Happily, the number has declined dramatically for the June 30 fiscal year.
Next, I want to touch on exchange rates and how they affect the results. It’s way more complicated than is the Australian dollar “strong” or “weak,” though that’s often how the issue is characterized.
Finally, I want to talk about how extensive and complex Billabong’s makeover is. Basically, they are rebuilding the company while running it. It’s kind of like highway construction, where you have to keep the road open while you redo it. It adds cost and slows down the process, but you’ve got no choice.
I want to point you to Billabong’s investor web site, where you’ll find the documents I discuss. Under “Featured Report,” I particularly suggest you take a look at the full year report presentation which they refer to in the conference call. The transcript of the conference call is also there.
Financial Results
All the numbers are in Australian dollars unless I say otherwise. At June 30, it costs you about $0.75 US to buy one Australian dollar.
For the year ended June 30, 2015, what they call “Revenue from continuing operations” was reported on the official financial statement as $1.056 billion (US$792 million based on the June 30 exchange rate). That’s up 2.82% from the prior calendar period (pcp) result of $1.027 billion. That does not include $10.6 million of other income this year and $6.3 million of other income in the pcp. It does include the revenue from brands that were divested at some point during the two years.
Gross margin rose from 52.2% to 53.1%. Selling, general and administrative expenses rose 1.6% from $423 to $429.6 million. Other expenses fell 23.1% from $165.9 to $127.7 million. Finance costs declined from $82.2 to $34.3 million, or by 58.3%. As you’ll see, much of those two declines were the result of the restructuring and refinancing expenses in the pcp.
Below is the rest of the income statement. Seems easier to show you than to describe it. The first column is for the year ended June 30, 2015 and the second for the pcp.
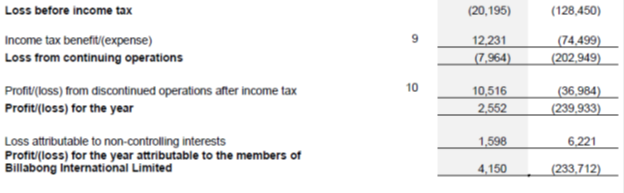
As you can see, as reported Billabong earned $4.15 million compared to a loss of $233.7 million in the prior calendar period. Mostly, the change from a big loss to a small profit is due to a reduction in all the costly tax, restructuring, and financial expenses they had last year.
Okay, now let’s take out the businesses they sold and their significant items. They do that for us in the presentation they used at the conference call. Page 22. Billabong sold it’s 51% stake in SurfStitch and it’s 100% ownership in Swell on September 5, 2014, which is in the most recently ended fiscal year. West 49 was sold in February of 2014. Dakine was out the door in July of 2013. Discontinued operations generated $196 million of revenue in fiscal 2014, but only $15.4 million in fiscal 2015.
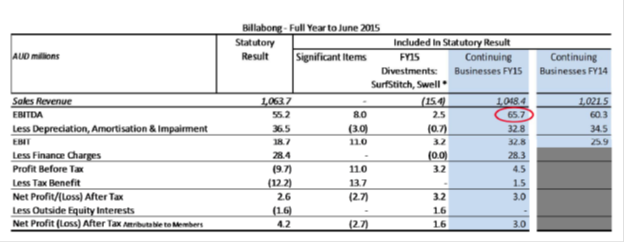
The first thing I’ll point out before somebody points it out for me is that the Sales Revenue number of $1,063.7 million is not the same as in the numbers from the official financial statement I just quoted. I’m not saying it’s wrong. I just can’t figure out why it’s different.
Taking out those items leaves us with a slightly reduced net income (from $4.2 to $3.0 million) for the June 30, 2015 fiscal year. More importantly, comparing the last two columns in the chart, you see an increase in EBIT from $25.9 million in the pcp to $32.8 million for the June 30, 2015 year.
Okay, significant items. For you data geeks, go to the Billabong investor web site. Under “Featured Reports” click on “Full Year Reports to 30 June 2015.” Go to page 69. Look at note (dd) “Significant Items.” I won’t blame you if you don’t read every word, but you might just peruse the list and note the discretion management seems to have in terms of what is or is not classified as a significant item.
If you want to suffer even more, go to page 86 of the same document where Note 8 starts. It lists all the significant items for the recently ended fiscal year and the pcp. A more detailed description of just what those items are appears on the next two pages.
What!?! You didn’t hang on each word?! Yeah, me neither.
The good news is that the significant items from continuing operations totaled $24.7 million this year compared to $120 million in the pcp. After discontinued operations, the total fell from $146 to $11 million.
You can’t just ignore numbers of this size, and certainly some of these are one time numbers. But if I were an investor, or potential investor, in Billabong, I’d be digging into these to satisfy myself as to the improvement of the continuing business from last year to this year.
Now let’s move on to the results by segment. First, as reported.
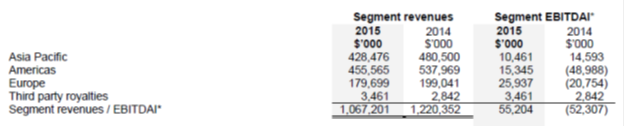
You can observe revenue drops for Asia Pacific, the Americas, and Europe of 10.8%, 15.3%, and 9.7% respectively. EBITDAI fell by 28.3% in Asia Pacific, but improved dramatically in the other two segments. The result is a $107 million turnaround is EBITDA as reported.
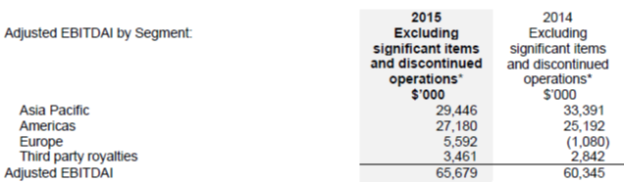
Taking out the discontinued operations and significant items gives a different segment and total EBITDAI result. The change in EBITDAI is not nearly as dramatic but, then again, it shows as positive in the pcp.
The next chart in the report is EBITDAI in constant currency. I’m not even going to show you that and I guess this is a good place to explain why.
Foreign Exchange
In the first place, if you’re an Australian investor in Billabong, I expect you mostly care about results in Australian dollars. But perhaps more importantly, there is a complexity here that goes way beyond whether the Australian dollar is “strong” or “weak” against the US dollar.
Billabong management does a great job trying to highlight and explain this. They provide a chart on page 71 of the document I point you to above that shows their exposure in Australian dollars, US dollars, Euros, and “other” currencies. There are both assets and liabilities involved and, if most of the exposure is in the first three currencies the “other” is not insignificant. Billabong “…receives revenue in more than ten currencies…”
In the conference call CFO Peter Myers spends way more time on this issue than I would have expected. Just to give you a way to think about all the moving parts, here are a few things he says. This would be a place where you can skim a few paragraphs if you want to, but I think it’s important.
“As an Australian listed entity with US operations, it is logical for us to have a significant part of our debt denominated in US dollars to match our foreign currency assets with foreign currency debt. So whilst it is true that the Aussie dollar equivalent of our debt is higher, so is the Aussie dollar value of our businesses and our US dollar earnings…”
“…the Aussie dollar value of businesses that are predominantly US-based, like RVKA and BZ, and the value of our US dollar earnings from our more global businesses like Billabong are also growing in Australian dollar terms. We also have US dollar cash flows to match our US dollar interest obligations.”
“So before that allocation of central costs, the Australian dollar value of the earnings from the Americas was AUD42 million, or about $35 million. So you see we have the Americas give us US dollar EBITDA of $35 million to match our US dollar interest obligations of $25 million, but — and it’s a significant but — it does serve to reinforce how important it is to us that we build the earnings base in North America, as it’s obvious the FX changes do impact on all of our financial ratios, et cetera.”
“The other big impact of the currency is in our input prices, the product purchases. In APAC alone, and bear in mind there is a European effect here as well, we have cost of goods sold of over AUD150 million, the vast majority of which is bought in the US dollar-exposed market.”
Sorry to let Pete go on for quite so long there, but I thought it important you appreciate the complexity and all the moving parts. While currency movements in the recently ended year may have been more dramatic than usual, the issue isn’t going away. At the end of the day, however, it’s how many Australian dollars of net income Billabong generates that will be the barometer of the company’s success or failure.
Reducing Complexity
Billabong’s brands include Billabong, Element, RVCA, Kustom, Palmers, Honolua, Xcel, Tigerlily, Sector 9 and Von Zipper.
“The Group operates 404 retail stores as at 30 June 2015 in regions/countries around the world including but not limited to: North America (60 stores), Europe (102 stores), Australia (123 stores), New Zealand (30 stores), Japan (46 stores) and South Africa (27 stores). Stores trade under a variety of banners including but not limited to: Billabong, Element, Surf Dive ‘n’ Ski (SDS), Jetty Surf, Rush, Amazon, Honolua, Two Seasons and Quiet Flight. The Group also operates online retail ecommerce for each of its key brands.”
Some of those stores carry multiple brands. Others don’t. About 55% of revenues are from wholesale. No single customer is 10% or more of their revenues. They expect to close around 40 stores this year, but have a new store model they believe gives them the opportunity to open new ones, so the net number of stores may not change much.
That’s a lot of moving parts in a lot of countries for a company that did just over a billion dollars Australian during the recently ended year. You probably also recall that Billabong’s brands operated pretty independently for a long time. The company is moving to change that in the name of efficiency and brand building. To me, Billabong really couldn’t support the implicit inefficiencies in the structure it had with the revenues it’s generating.
Let’s see what they’re doing.
CEO Neil Fiske has a seven part strategy the company has been implementing since shortly after he came on board in September, 2013. From their filed report, here are the strategies and descriptions of what they involve.
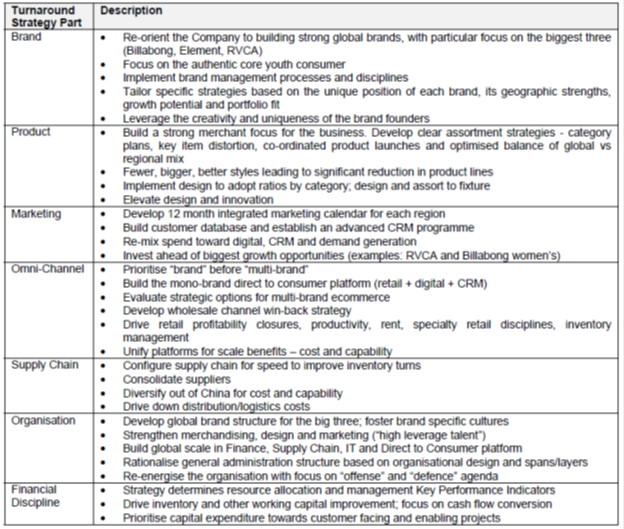
I want to make a few general comments on this. First, you should note that pretty much no part of the business is untouched. Second, while this will ultimately save them a lot of money (they have for example cut the numbers of suppliers they work with by 50%) it’s going to cost a bunch of money to implement.
Third, there is a certain urgency to doing all this, and an imperative to interconnect these functions that wasn’t so important or at least so necessary 10 years ago. And I will point out that doing much of this doesn’t create a long term competitive advantage. It’s just what Billabong, as well as other larger companies in our space, have to do to have the chance to compete. Certainly when you looked at the chart above you noted that many of the actions they are taking seem obvious and necessary.
You may even have asked, “How the hell can they not have done this stuff before now!” I have no idea what went on inside Billabong, but trying being the CEO of a publicly traded corporation and explaining to your board of directors that you’re going to rip the place apart, it’s going to take a couple of years to reconfigure, it will cost a lot of money, it may not work out, and in the meantime, your earnings are going to suck. Good luck with that.
Typically, the pressure has to come from an outside change agent.
Neil also talks about their “…fewer, bigger, better…” approach. This means that they are focusing on their three big brands; Billabong, RVCA and Element. That was a financial imperative for a money losing company, and it’s certainly the place where they can see the most immediate return. Think of it in percentage terms. A 5% increase in Billabong branded sales is way more dollars than a 5% increase in Von Zipper, and larger brands will benefit more from the various restructurings going on.
The other brands aren’t insignificant, though we don’t know how much revenue they are doing. We are told the big three represent something like two-thirds of the wholesale business worldwide.
CEO Fiske tells us that “…Tigerlily has shown standout performance once again. Sales are up over 40% and comp store sales grew 7.8% for the year. Collectively, the rest of the emerging brand portfolio was down in sales and EBITDA. With the progress of the big three brands well underway, we can now focus on the strategy and the performance of the emerging brands.”
This is the first time they’ve said much about the other brands. I still won’t be surprised if more get sold, but it’s hopeful that they think they have the breathing room to give them some attention.
Here’s a series of comment Neil made about Europe. “Gross margins [He’s talking in constant currency] lifted 650 basis points for the year as we focused on quality revenue, quality accounts, quality distribution…Revenue for the year declined 1.7% as a result of our decision to narrow our account base, tighten trading terms and build margin… In retail, comp store sales for the region were up 2.9%. Store level profitability improved 160 basis points before the effect of provisions, driven by the improvement in retail gross margins. Total store count at year end was down from 111 to 102 as we rationalized our network of outlet stores from 24 to 17 and country presence from nine to five.”
I added the emphasis. Note the focus on quality, simplification, margin, branding and efficiency over sales growth. Or rather, the confidence that those things will lead to sales growth. This is a theme not just for their European operations, but across the other segments and found in their strategy as well.
I haven’t focused as much on brand and segment specifics as in previous Billabong reports. I really don’t want us to get lost in the weeds right now.
I’m kind of going “Billabong blind” from shuffling through all these documents and trying to create a coherent whole, but I think it was CFO Myers who said, somewhere, that he was surprised to be calling such a small profit a turning point for the company.
I know what he means. Currency, significant items (I know, I just can’t leave that alone) and divestitures make it something of a challenge to compare results over years, but there is the sense that the elements of the strategic makeover are starting to have an impact. Maybe a better way to put it is that it really feels for the first time like rebuilding the road while they drive on it is something that has a reasonable chance of succeeding.
The balance sheet is at least stable. Operating results seem to be improving and even where they aren’t improving, there’s some sense of progress in doing the things that will improve them.
The problem is most definitely not solved. There are currency issues, work remains on their retail operations, the overall economic environment isn’t too great, and completion of the systems and structural transition will take a couple of years. But things are better than a year ago and the path seems a bit clearer.


Leave a Reply
Want to join the discussion?Feel free to contribute!