You’d think I’d be getting used to it, but I still find myself surprised when another one of our industry’s public companies reports a strong quarter or, in this case, year. The reasons are tending to be similar across reporting companies; higher gross margin, customer lust to get outdoors, ecommerce growth, expense reductions, government help (not quite sure how I feel about that for companies that don’t need it), making deals with landlords, maybe competitors screwing up, flexibility, reductions in expenses that will return next year, and the ability to continue to pursue their strategies.
Successful companies are ones who had strategies in place to deal with the changing retail environment before pandemic was a thing. They just had to accelerate what they were already doing. They even found opportunities amidst the initial chaos. Zumiez was one of those.
Let’s do a review of the numbers as a basis for a more strategic discussion.
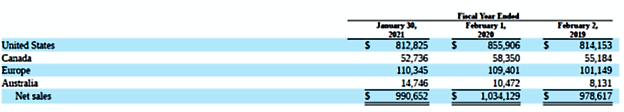
Net sales for the year ended January 30, 2021 fell 4.16% from $1.034 to $0.991 billion. The sales decline was the result of covid related store closing. Stores were open 78.4% of possible days. The revenue decline “…was partially offset by a 13.6% increase in comparable sales driven by the increase in ecommerce sales as well as the strong performance of our physical stores upon re-opening.” The chart below shows sales by region for three years.
Gross profit margin declined from 35.4% to 35.3%. “The decrease was primarily driven by a 120 basis point increase in web fulfillment and shipping costs due to increased web activity as a result of COVID-19…and a 30 basis point increase due to the impairment of operating lease right-of-use assets. This was partially offset by an 80 basis point decrease in inventory shrinkage and a 70 basis point increase in product margin.” You’d expect shrinkage to decline when stores are closed.
SG&A expenses were down 9.9% compared to last year, falling from $280.0 to $253.1 million. As a percentage of sales, they declined from 27.1% to 25.5%. Why?
“The decrease was primarily driven by a 70 basis point decrease due to governmental credits, a 60 basis point decrease in store wages, a 30 basis point decrease in national training and recognition events and a 20 basis point decrease in corporate costs.”
None of those would have happened without the pandemic. If SG&A expenses had been the same as last year, operating income would have been $69.3 million rather than the $96.9 million reported. But of course, revenues would have been higher- if only because there would have been no store closures.
Pretax income rose from $91.0 to $102.5 million. “Our bottom line performance benefited from both our optimization efforts within the model as well as from the onetime adjustments we have made in response to pandemic around managing our payroll costs, reducing events, travel and training, managing marketing efforts, working with our landlords, receiving governmental subsidies tied to continue to pay our people and reducing projects and other expenses as feasible, given the uncertain nature of the environment,” said CFO Chris Work in the conference call.
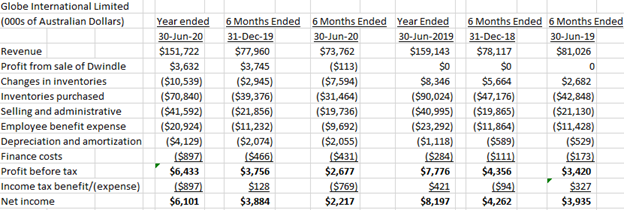
Comparing this year’s fourth quarter with last year’s, we see sales growth from $328.7 to $331 million. The gross profit margin rose slightly from 39.0% to 39.1%. Net income for the quarter rose from $37.9 to $42.8 million, or by 12.9%.
The balance sheet and cash flow are both solid.
Let’s recall what Zumiez sees as it’s competitive strengths as stated in the 10-K.
- Attractive lifestyle retailing concept.
- Differentiated merchandising strategy.
- Deep-rooted culture.
- Distinctive customer experience.
- Disciplined operating philosophy.
- High-impact, integrated marketing approach.
No surprises here for any followers of Zumiez. I’d highlight the 100 non-owned brands they introduced during the year (many of them exclusive to Zumiez) and the lack of silos in Zumiez’s operating style. By lack of silos, I mean Zumiez has recognized the interrelatedness of all functions, and the need for information to flow quickly and seamlessly among the integrated functions.
Meanwhile, the growth strategies include:
- Continuing to generate sales growth through existing channels.
- Enhancing our brand awareness through continued marketing and promotions.
- Opening or acquiring new store locations.
I’d say Zumiez lists them in order of importance. Discussing the first they note, “We believe in driving to the optimum store count in each physical geography that we operate in and optimizing comparable sales within these markets between physical and digital to drive total trade area sales growth.”
“Optimizing” may not mean more. Might mean fewer- especially in the U.S. where, as they acknowledge, they are pretty well built out. Actually, an even more intriguing question is, “What’s a ‘store’?”
I know- I must be losing it but hear me out. Maybe I can get some help from CEO Rick Brooks.
“We build an infrastructure in which the customer can shop with us to get what they want, when they want, how they want as fast, as they want. We’ve marked our business into a channel less organization with inventory visibility from all touch points and back-end capabilities that allow us to effectively leverage expenses regardless of the channel in which the sale originates.”
“Touch points.” Yeah, I like that phrase. How about the vans that are doing Zumiez Delivery in 26 of their trade areas in the U.S.? During their fourth quarter they delivered, from 150 stores, about 55,000 packages. Are those vans stores? It depends on how they are used. They are certainly “touch points.” Recognizing that traditional stores exist and will continue to exist, a successful strategy requires thinking of them as just another touch point.
The touch point strategy is enabled by their trade area concept. Or maybe it’s the other way around. They talk about delivering in 26 trade areas and say that’s about half the trade areas they expect to operate in. But we don’t know how many trade areas Zumiez has or will have in total. Or if the number will be stable. I’m guessing it will evolve with the market and the customer.
My definition of a trade area is an amalgamation of touch points that relate to a particular customer group. I think each trade area represents a distinctive geographic area, but I’m guessing that geography is not necessarily the single defining attribute. Some touch points will be ubiquitous to all trade areas. The Zumiez ecommerce site for example. Though the web site you see will vary depending on the customer information Zumiez has, the trade area you are in, the status of inventory and probably other things I haven’t figured out.
This integrated, flexible distinctiveness is a requirement of the market. Here’s what Rick says.
“Our consumer, in fact, I think, not just our consumer, all consumers, expectations, they’re getting what they want, when they want, how they want as fast they want has never been higher, and we believe those expectations for speed are going to increase even more over the next five years. Another assumption we believe to be true is that the speed of trend cycles and brand cycles, already the fastest ever, are also going to continue to increase.”
Zumiez wants to “…create even more human-to-human connections, whether they be digital or physical, right?” Human to human digital connections (kind of an oxymoron?) makes me wonder even more what a “store” is. Those connections, by the way, aren’t just between Zumiez and their customers. It’s among their customers as well and, I wonder, what other stakeholders.
I expect Zumiez will be surprised by, and be able to take advantage of, some of that connectiveness as their stakeholders define and evolve it.
With regards to brand awareness, I already noted the increase in advertising even in the pandemic year. Remember what I said a hundred years ago? “The best retailers make the brands they carry cool, not just the other way around.” That brand building is increasingly important because (cue Rick again),
“Our Gen Z consumer is simultaneously a local and a global consumer. They want to be active in their local communities while being part of the same global communities. This concept applies in how they — our customer pursues their personal areas of passion and in their expectations that will be the source of bringing cool new brands from anywhere in the world to their local store.”
Zumiez ended the year with 721 stores- “…602 in the United States (“U.S.”), 52 in Canada, 54 in Europe and 13 in Australia.” They expect to open 22 new stores in the current fiscal year. Currently, they expect to open 5 stores in North America, 12 in Europe, and 5 in Australia. Five or six stores will be closed.
I’ve been assuming that Zumiez’s greatest growth opportunities were outside of North America. But the way the market has evolved (good deals available from landlords) and the trade area concept is making me question that idea- at least a little.
Conventional wisdom has always been that the German market is different from the French market is different from the U.S. market. True of course, but if Zumiez can build a “global community” under the umbrella of its brand perhaps that’s not quite the impediment it used to be. Zumiez sees brands, system tools, customer analytics, perhaps forms of touch points migrating around the world as their markets evolve.
Zumiez is finding advantage, as well as challenges, in the pandemic. So are other companies who started working on the retail transition long before the pandemic happened.